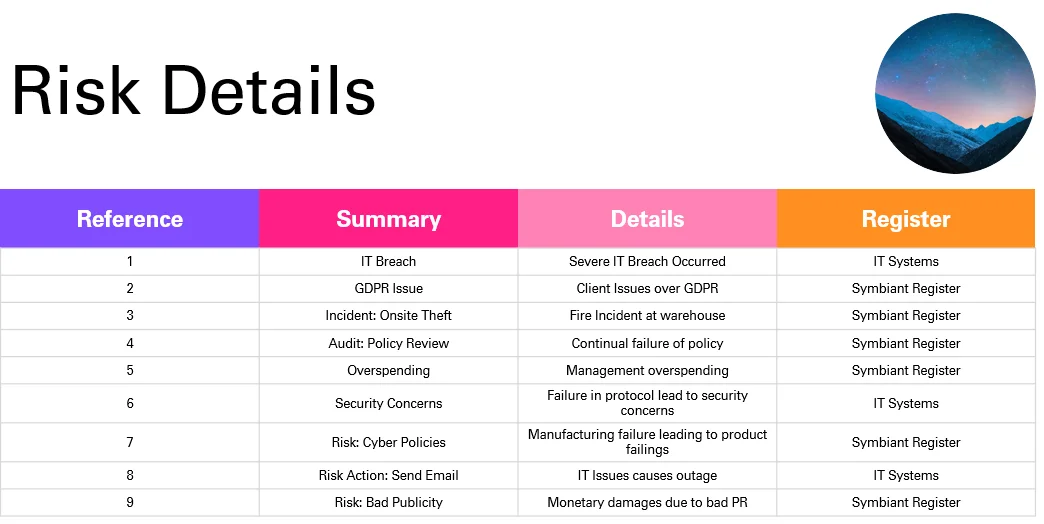
How to create a simple PowerPoint report to output system data
Accessing Reports #
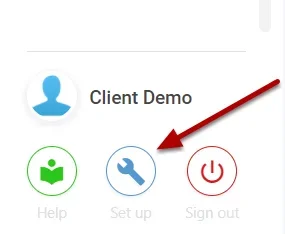
Navigate to Setup by selecting the spanner at the bottom left.
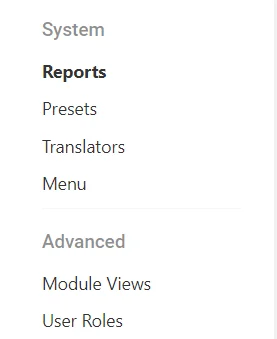
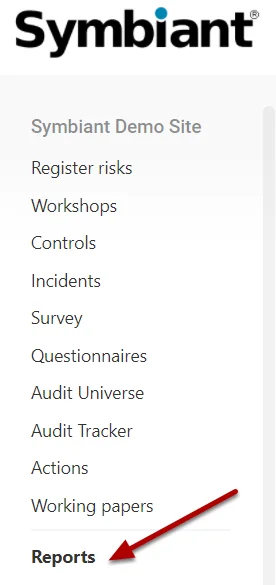
Select Reports,
Select the plus icon to create a new report,

Report Details #
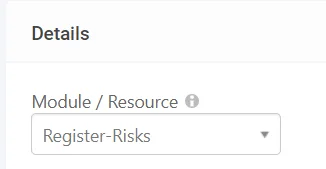
First select which Module we want the report to pull data from, for example, Register Risks, Controls, Incidents, Workshops etc.
Name the report,

Report Type #
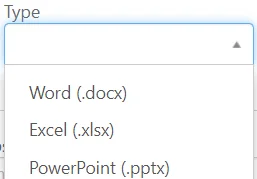
Select the Type of report, in this example PowerPoint (.pptx)
Report Assignment #
Next, we need to assign who can see/generate this report, you can select specific Users, Roles and Divisions, for our example we will allow Admin and Risk Admin users to access,

Configuring the Report #
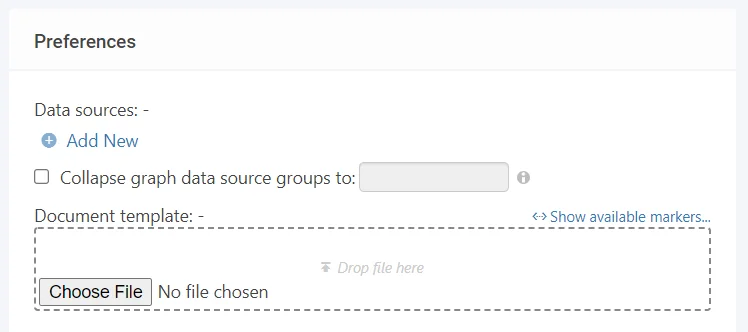
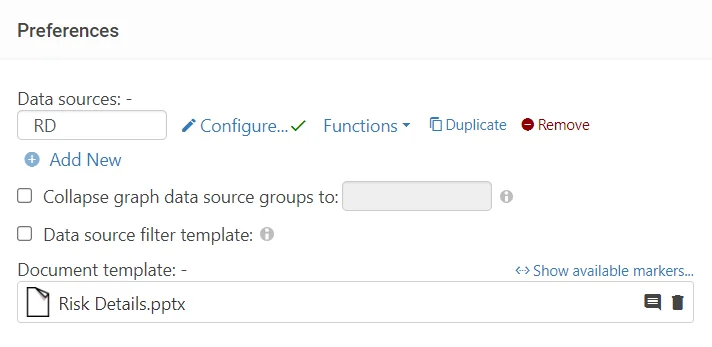
On the right-hand side, under Preferences, you can configure your report,
Data Source Selection #
First, you need to configure a Data Source, there are three distinct types of Data Sources,
For our example, we shall be using a Graph-based structure,
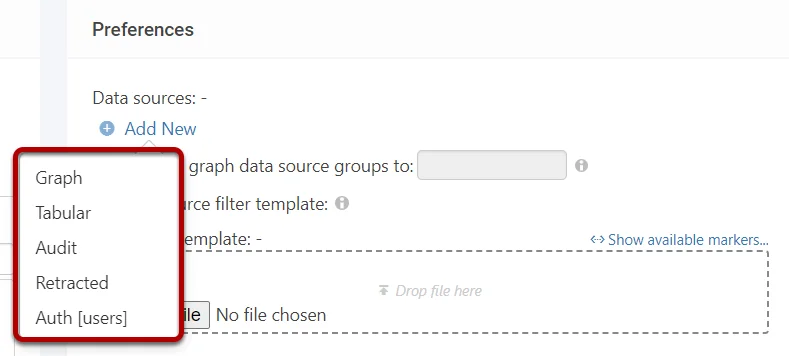
Graph – Pulls a graph-based data structure with entity relationships and allows for the nested selection of attributes. The most common use!
Tabular – Pulls a flat data structure, where each column represents one value, (Like in excel)
Audit – Pulls an Audit data structure used to retrieve historical data about record change history.
Retracted – Pulls a Retracted Record structure used to retrieve a list of any records within a module that were deleted (Archived)
Auth [Users] – Pulls an entire list of all User details, Roles, Divisions etc.
Configuring the Data Source #
Name the Data Source, and ensure a good naming convention here! In our example, as we are pulling the Risk Details we will just name it RD,
Next, select the Configure option,

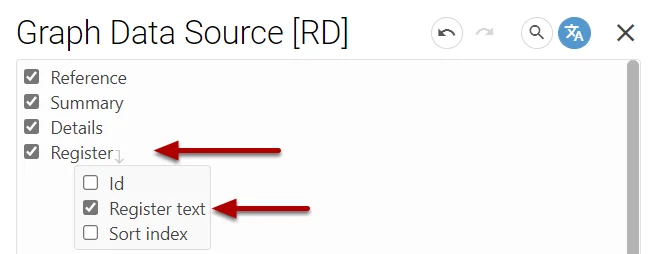
The data source configuration screen shall be shown, here is a list of all attributes we could pull into our report,
Note: To make this easier to read select the Translate option at the top right!
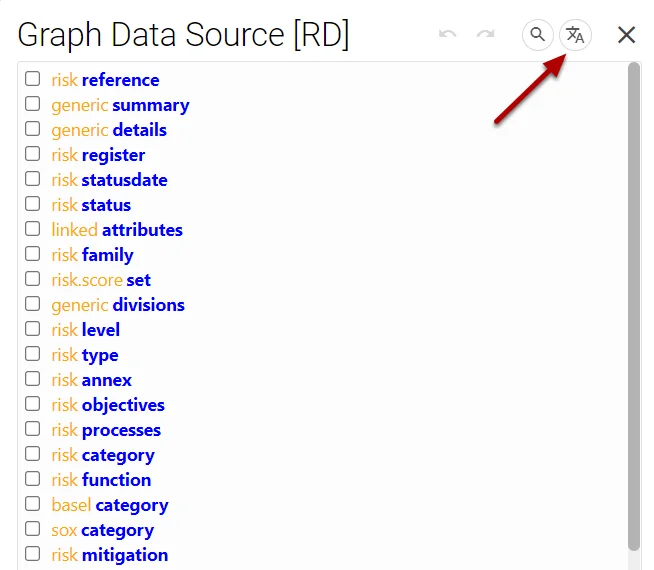
Next tick which attributes you want to have pulled into your report, drop downs and nested items such as the Risk Register, will need their Root Attribute and Text value selecting,
Once you have finished selecting the attribute you want to use, select the OK at the bottom right,
Tag Generation #
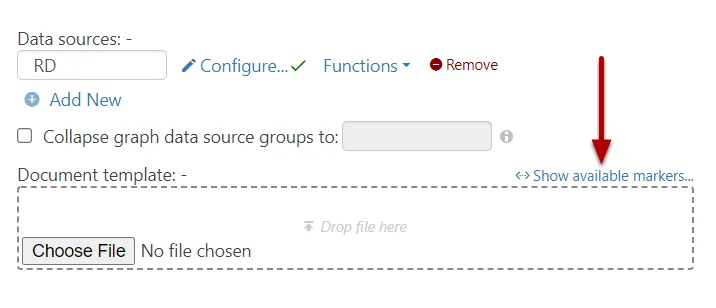
When attributes are selected within a Data Source, Tags get created, you need these for the PowerPoint template, to access these select, Show Available Markers,
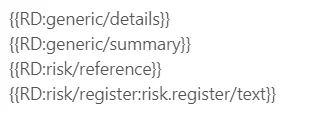
All the tags will be listed here,
Template #
Within PowerPoint, create a template, this can be in any design, layout and style you wish,

Copy and paste the Tags generated by the system into your template, as shown below,

Uploading the Template #
Once your template is created, navigate back to the system. Select the Choose File option and select your template,

Now your template is uploaded, and the Data Source has been configured the report is ready!
Save the report at the top right.

Generating the Report #
Exit Set Up mode from the bottom left,
Select Reports,
Find your report and select Generate!
![]()
Report Output #
Your report should generate and the data will automatically be loaded in.
