 Doc Summary

This article shows you how to create a simple Excel report that outputs data from a module.
Applies to: System administrators (
adminrole) · Module: Set up > Reports
Opening Reports #
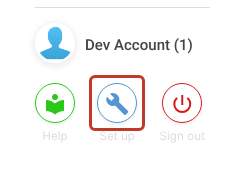
- Click the Set up spanner at the bottom left of the screen.
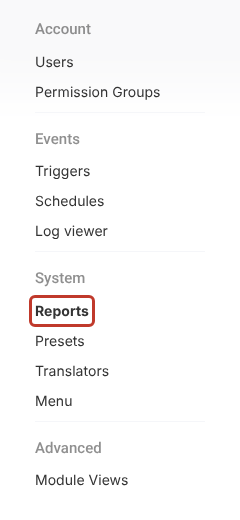
- Under System, click Reports.
- Click the + at the top right to start a new report.

Report Details #
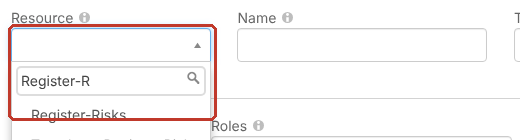
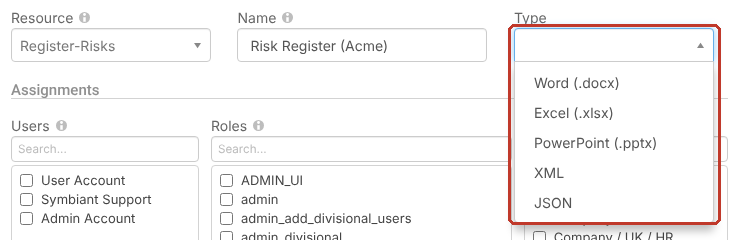
- In Resource, choose the module the report pulls data from, for example Register-Risks. Type to search the list.
- In Name, enter the report’s name as users will see it, for example
Risk Register (Acme).
- In Type, choose Excel (.xlsx). The full list is Word (.docx), Excel (.xlsx), PowerPoint (.pptx), XML and JSON.
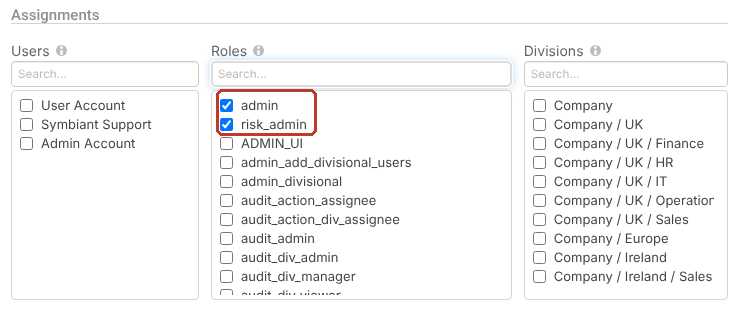
- Under Assignments, tick who can generate the report: users, roles and/or divisions. In this example, the admin and risk_admin roles. See Reporting Permissions.
Once a type is chosen, the Preferences panel on the right is where you set up the data and the template.
Adding a Graph Data Source #
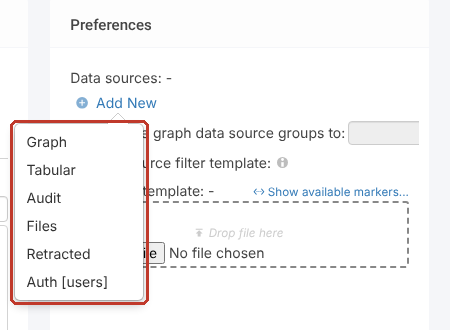
A data source decides which records and fields the report pulls. The types are:
- Graph: records with their linked data, where you tick the fields you want, including nested ones. The most common choice.
- Tabular: a flat list where you choose each column. See Creating an Excel Tabular Report.
- Audit: the history of changes to records. See Creating an Excel Audit Report.
- Retracted: records that have been deleted (archived).
- Auth [users]: all users with their roles and divisions.
- Files: files attached to records.
- Under Data sources, click Add New, then Graph.
- Replace the generated name with a short one, for example
rd(risk details). You’ll use it in every marker, so keep it short. Then click Graph… to choose the fields. The ✗ next to it turns into a ✓ once fields are chosen.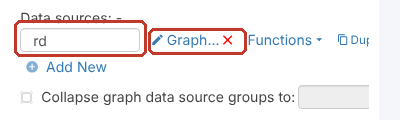
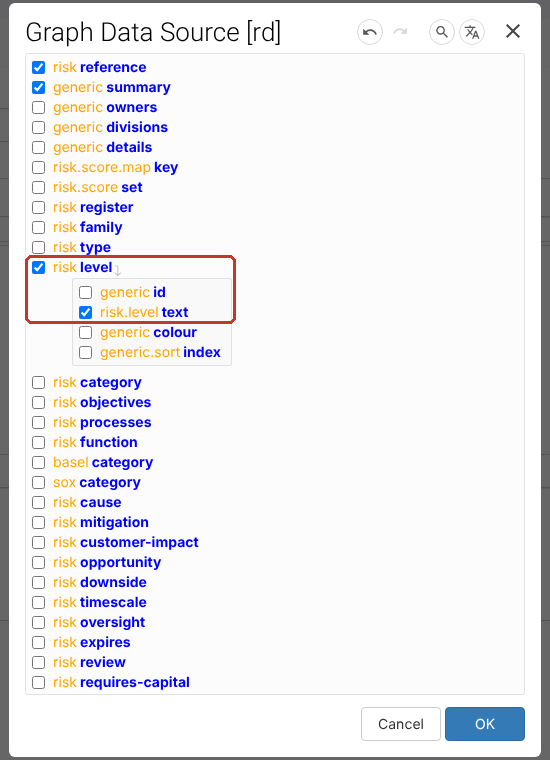
- Tick the fields you want. For drop-down fields such as Level, tick the field and then its text value underneath.
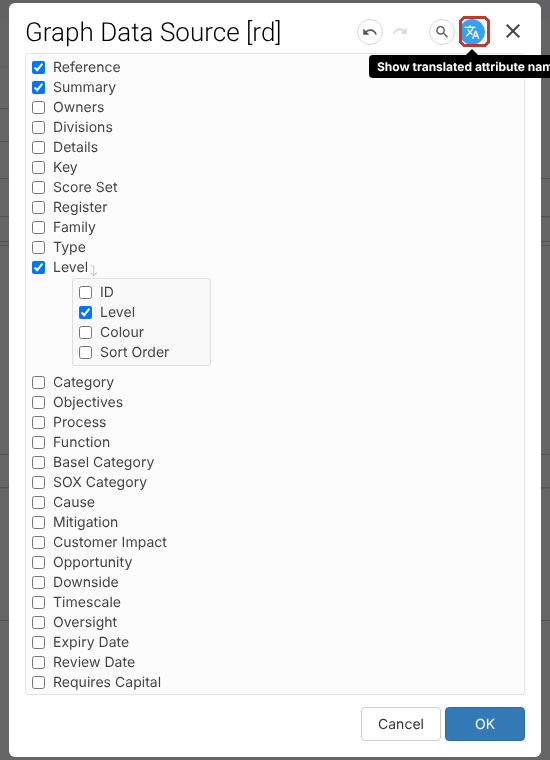
- To see friendly field names instead of system keys, click the Show translated attribute names icon at the top right.
- Click OK.
Getting the Markers #
Each ticked field becomes a marker you put in your template. Click Show available markers… above the document template to list them.
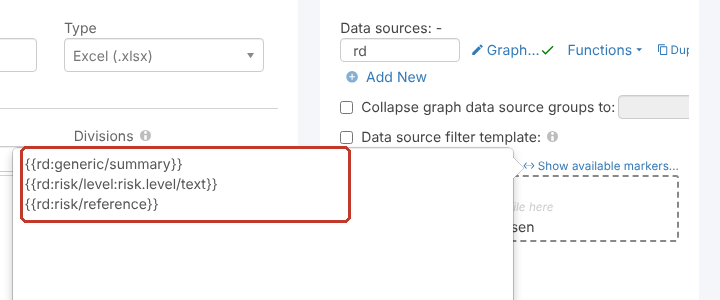
A marker is the data source name and the field key in double curly brackets, for example {{rd:risk/reference}}. Word templates can also use double square brackets, for example [[rd:risk/reference]].
Building the Excel Template #
- In Excel, create a header row with your column names.
- In the row underneath, paste one marker into each column. When the report runs, this row is repeated once for each record.

In this example template the data source is called data, so the markers start {{data:.
- Save the file as
.xlsx.
Tip: Download an existing report’s template (click its file name under Document template) and use it as a starting point.
Uploading the Template #
- Under Document template, click Choose File (or drag the file onto Drop file here) and pick your template.
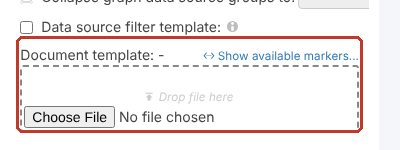
- Click Save at the top right.

Generating the Report #
- Click the Set up button at the bottom left to leave Set up.
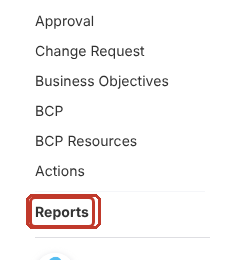
- Click Reports at the bottom of the menu on the left.
- Find the report (type part of its name in the Name filter) and click Generate. The file downloads to your computer.

Tip: Click Filter next to Generate to limit which records go into the report. See Advanced Filtering on Reports.
The Output #
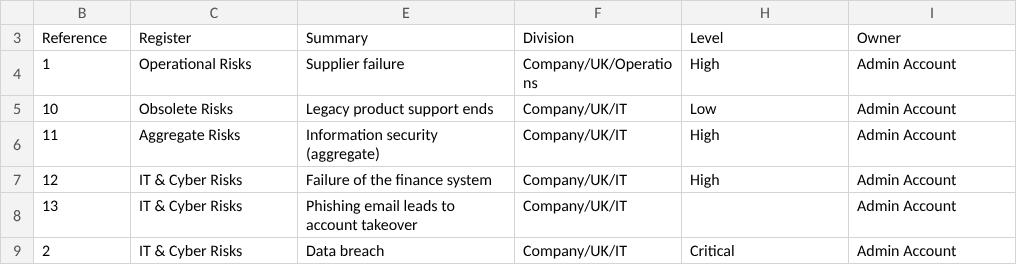
Each record appears on its own row, with the markers replaced by the data.