
 Doc Summary

How to rename, tidy up, copy or remove the charts at the top of a module dashboard, change the field a chart shows, and save the change for everyone who uses that view.
Applies to: system administrators (admin role). Module: any module with a dashboard (the example uses Incidents).
Before You Start #
- Chart changes are part of the module’s list view. They only reach other users once you save them to a view with Admin > Save…, so work on your company-specific view, not a -generic one. See Creating Your Own Custom Views.
- If you only want to rearrange charts for yourself (tabs, grow, shrink, group), use Dashboard Layout Tools instead. Those changes don’t affect anyone else.
The Chart Options #
- Open the module, for example Incidents.
- Click the three dots (⋮) at the top right of the chart you want to change.
Administrators see three extra options above the layout tools:
- Set up… (1): opens the chart’s settings.
- Duplicate (2): adds a copy of the chart next to it.
- Remove (3): takes the chart off the dashboard.
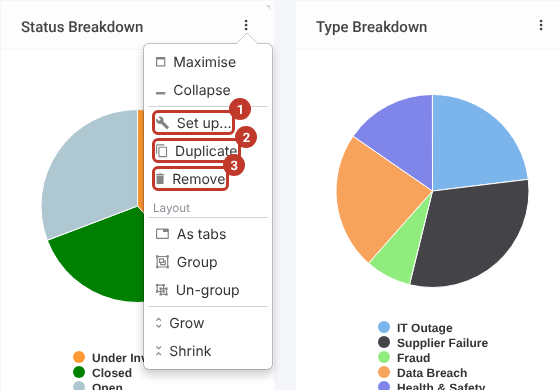
Note: Users without admin rights only see Maximise and Collapse on this menu.
Changing a Chart’s Settings #
- Click Set up… on the chart’s menu. The chart editor opens.
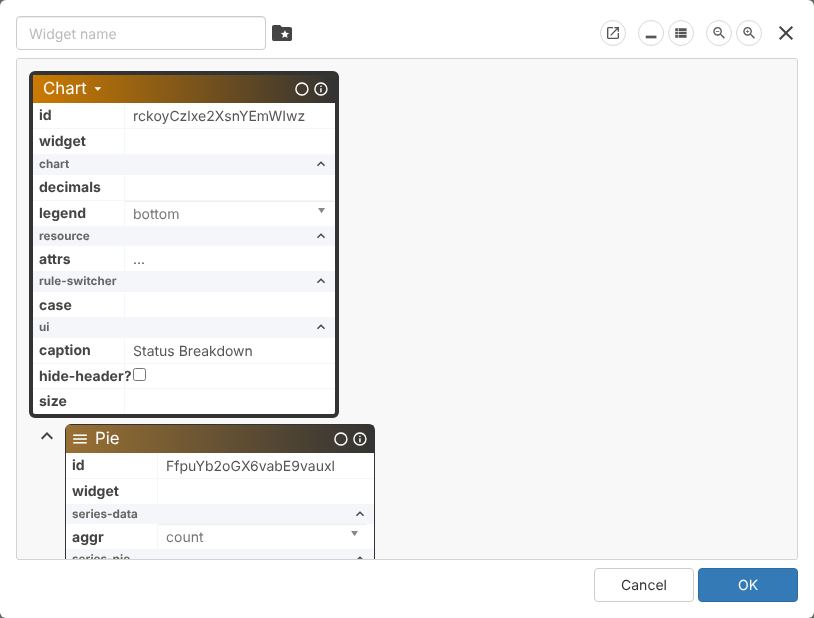
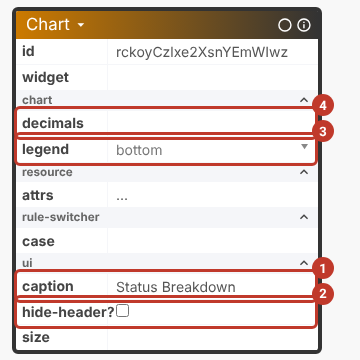
The editor shows the chart as boxes of settings. The top box (Chart) holds the settings for the whole chart:
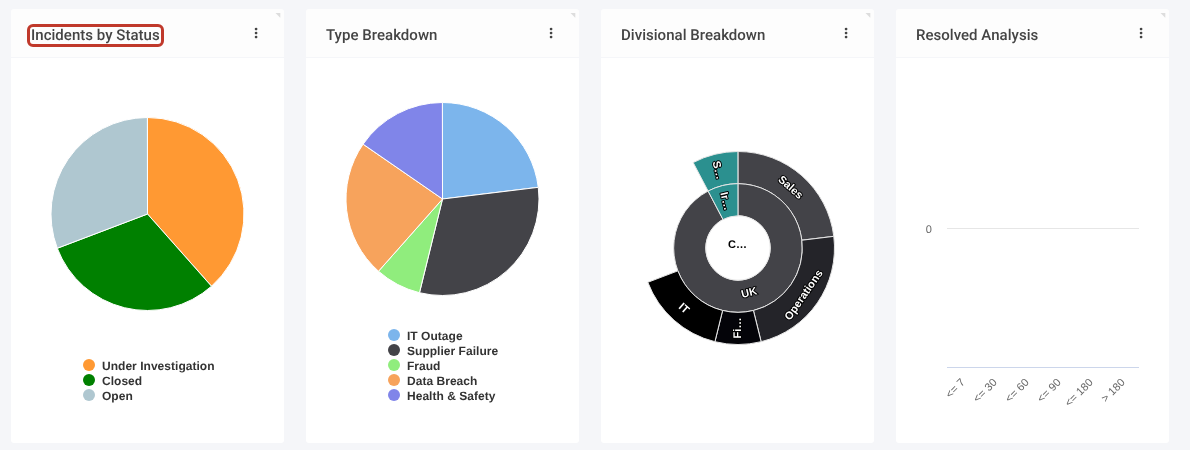
- caption (1): the title shown at the top of the chart, for example change Status Breakdown to Incidents by Status.
- hide-header? (2): tick to hide the title bar.
- legend (3): where the key is shown: bottom, top, left, right or hidden.
- decimals (4): how many decimal places to show for values.
Scroll down to the box for the chart type (here Pie). Its settings depend on the type. For a pie chart:
- aggr (1): how records are counted. count (the number of records) is the usual setting; the other options (avg, sum, min, max and so on) are for charts built on a number field.
- percentage? (2): tick to show each slice as a percentage instead of a count.
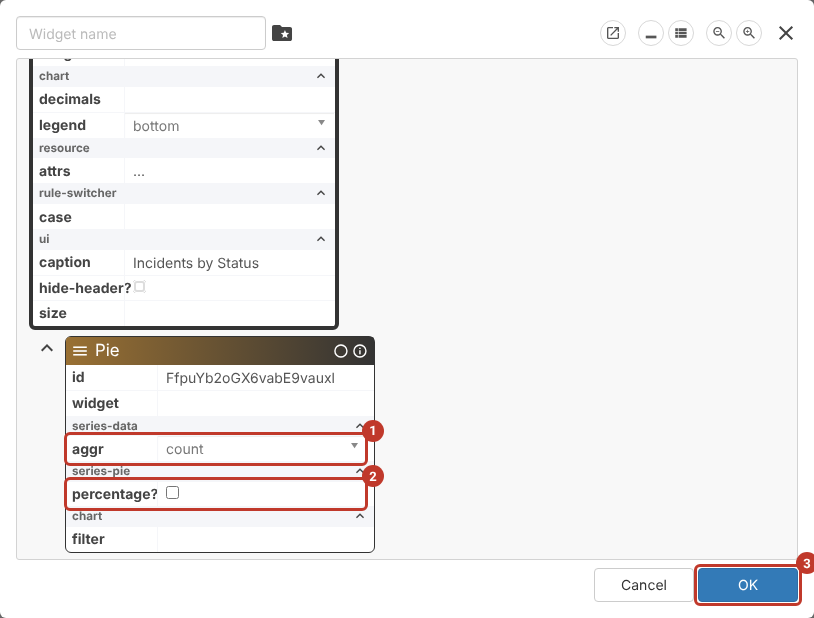
- Make your changes, then click OK (3). The dashboard updates straight away, but only on your screen until you save the view (see below).
Note: Other chart types have their own settings. For example, the Resolved Analysis bar chart has a Column box with band and period settings.
Copying or Removing a Chart #
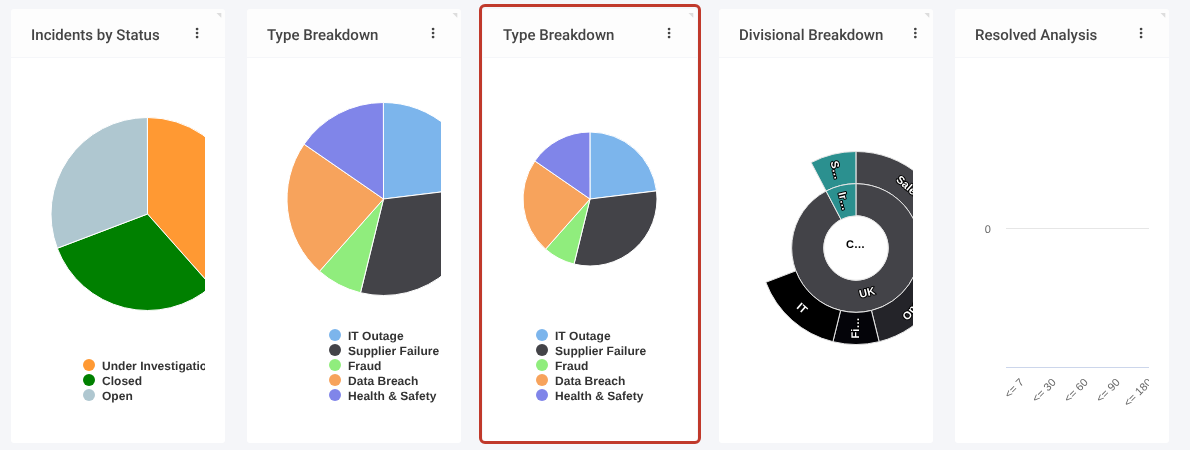
- Duplicate adds an identical copy next to the original (highlighted below). Use Set up… on the copy to give it its own caption and settings.
- Remove takes the chart off the dashboard. Nothing is deleted from your records.
Tip: Changed your mind? Leave the module and come back before saving: the dashboard goes back to the saved view.
Changing the Field a Chart Shows #
Charts break records down by one field, for example Status or Type. To change that field you need the field selector (shown as attr in the editor). It is switched off by default; ask Symbiant Support to turn it on for your administrator account.
A quick way to build a new chart is to duplicate an existing one of the same type and point the copy at a different field. In this example a copy of Status Breakdown becomes Impact Breakdown.
- Duplicate the chart (see above), then click Set up… on the copy and change its caption, for example to Impact Breakdown.
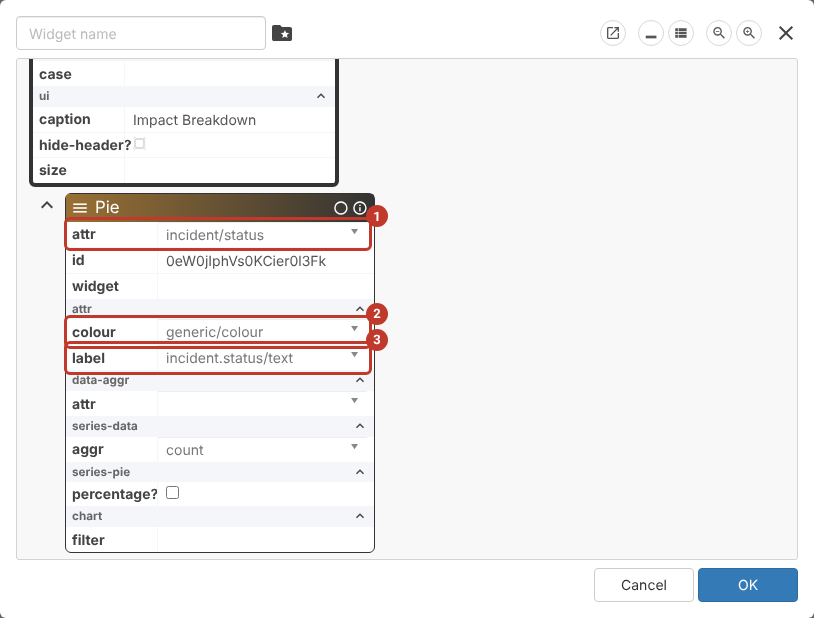
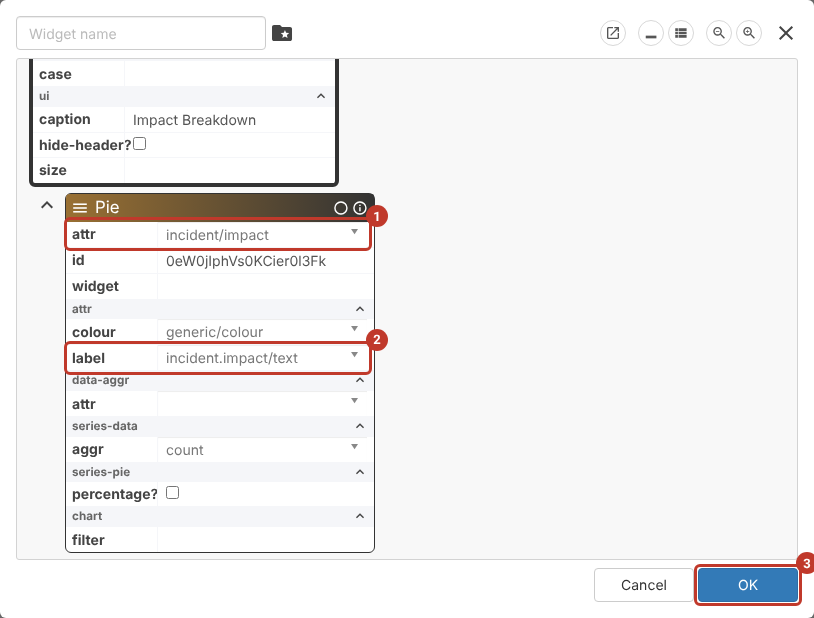
- Scroll down to the chart type’s box. With the field selector switched on it shows three extra settings: attr (1), the field the records are grouped by; colour (2), which colour each slice uses; and label (3), the text shown in the legend.
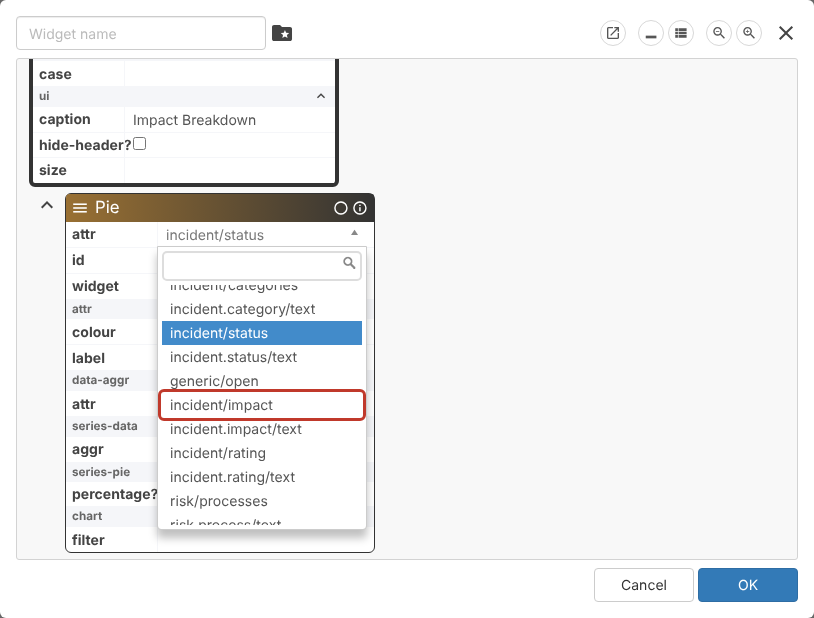
- Click the attr box and pick the new field, for example incident/impact. Fields are listed by their system names; type part of the name in the search box to find one.
- Change label to the matching /text entry, for example incident.impact/text, so the legend shows the option names. Leave colour as generic/colour to use the colours set on the drop-down list.
- Check attr (1) and label (2), then click OK (3).
The new chart appears straight away, using the field’s options and colours. Save the view as described below to keep it.
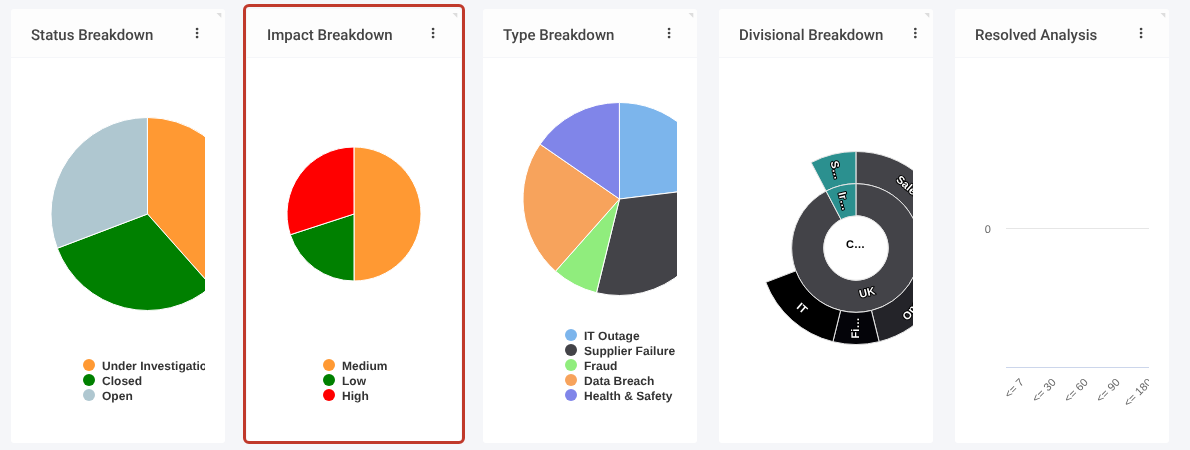
Note: Pie charts work best with drop-down fields that have a short list of options, such as Status, Type, Impact or Rating. For a drop-down field, attr is the field itself (for example incident/impact) and label is its text (for example incident.impact/text).
Saving the Change for Everyone #
- Click the three dots (⋮) at the top right of the screen, then Admin > Save….
- Pick your company-specific view to save over.
- Sign out and back in to see the saved change.
Critical: Don’t click the blue Save button at the top of the screen, and don’t save over a -generic view. See Loading/Saving a Particular User’s View.