
Skip to content
Symbiant System Black Logo
  • Home
  • Knowledge Base
  • Symbiant Website
  • Symbiant Changelog
  • Submit a Ticket
  • My Support Tickets
  • Home
  • Knowledge Base
  • Symbiant Website
  • Symbiant Changelog
  • Submit a Ticket
  • My Support Tickets
Popular Keywords importuserdivisionsamlimport risk

Admin Basics

  • Sharing Dashboard Layouts with Other Users
  • Setup Mode/Admin Menu
  • Creating/Adding Users
  • Transferring Ownership from One User to Another (Assuming)
  • Making a User Active/Inactive
  • Delete a User
  • Changing a Record Reference
  • Managing Drop-Downs, Multi-Selects, and Multi-Levels
  • Resetting a User’s Password
  • Checking System Attachment Storage
  • Database History & Restoring Historical Records
  • Restoring a Deleted Record (Archived)
  • Audit Trails
  • Email Log Viewer
  • System Menu Layout & Options

System Translations

  • Adding a Translation Pack
  • Editing a Translation Pack
  • Mass Editing a Newly Created Translation Pack
  • Assigning a Translation Pack to a User
  • Exporting a Translation Pack
  • Importing a Translation Pack
  • Adding a Default Translation Pack
  • Creating a Locale Specific View (Translated View)
  • Editing a Locale Specific View (Translated View)

Importing Data

  • Preparing Data for Import (Default)
  • Imports with Hierarchical Data
  • Importing Data (Generic)
  • Preparing Data for Import (Risks)
  • Importing Data (Risk Register Specific)
  • Preparing Data for Import (Users)
  • Importing Users
  • Importing Divisions
  • Importing Errors & Issues

Automated Emails (Task Based)

  • How Automated Emails Work (Triggers and Schedules)
  • Activating and Deactivating an Automated Email (Trigger) and (Scheduler)
  • Creating an Automated Email – When a Record is Created (Trigger)
  • Creating an Automated Email – When a Record is Updated (Trigger)
  • Creating an Automated Email – When a Record is Deleted (Trigger)
  • How to Receive Module Specific Emails as System Admin (Trigger) and (Scheduler)
  • Editing an Automated Email – Sending to a Different Module Role (E.g. Risk Manager) (Trigger)
  • Editing an Automated Email – Sending to a Record User (Trigger)

Automated Email Reminders (Time Based)

  • How Automated Emails Work (Triggers and Schedules)
  • Activating and Deactivating an Automated Email (Trigger) and (Scheduler)
  • Creating an Automated Email Reminder – When a Record is Due (Scheduler)
  • Creating an Automated Email Reminder – When a Record is Overdue (Scheduler)
  • Setting up Recurring Schedules
  • How to Receive Module Specific Emails as System Admin (Trigger) and (Scheduler)
  • Editing an Automated Email Reminder – Sending to a Different Module Role (E.g. Risk Manager) (Scheduler)
  • Editing an Automated Email Reminder – Sending to a Record User (Scheduler)

System Views

  • Editing a Dashboard Chart
  • Sharing Dashboard Layouts with Other Users
  • System Views (Quick Explainer)
  • Creating Your Own Custom Views
  • View Editor Tool Overview
  • Editing a View
  • How to Hide/Unhide Fields
  • Loading/Saving a Particular User’s View
  • What are Widgets?
  • Adding, Removing and Editing a Grid Column
  • Adding Help Tips & Placeholder text
  • Modifying a User Field to Limit or Allow Specific Users
  • Modifying a Currency Field to Set Default

Exporting Data

  • Exporting Dashboard Data
  • Exporting Divisions
  • Exporting Users
  • Generating the System User Details Report

System Errors & Issues

  • Resolving System Issues
  • System Error Messages
  • Login Issues

Reporting Suite Tutorial

  • Creating a Word Report (Basic Data Output)
  • Creating an Excel Report (Basic Data Output)
  • Creating a PowerPoint Report (Basic Data Output)
  • Creating an Excel Tabular Report (Perfect for CSV)
  • Creating an Excel Audit Report (Audit Log Of Changes)
  • Adding a new column to an Excel Report
  • Removing a column in an Excel Report
  • Creating an Advanced Word Report (Adding Functions)
  • Advanced Report Coding (Using Owners, Divisions & Assignees in a Report)
  • Advanced Report Syntax
  • Advanced Filtering on Reports (Filtering Via Code)
  • Reporting Permissions

Advanced System Functionality

  • Symbiant API

Document Management (System Setup)

  • Setting Up Document Types
  • Setting Up Document Statuses
  • Document Storage Limits and File Sizes
View Categories
  • Home
  • Knowledge Base
  • Admin Information
  • System Views
  • Editing a Dashboard Chart

Editing a Dashboard Chart

0:00 / 4:38
  • View as Markdown Open this page as plain Markdown (opens in a new tab)
  • Open in ChatGPT Ask questions about this page (opens in a new tab)
  • Open in Claude Ask questions about this page (opens in a new tab)
  • Open in Google AI Studio Ask questions about this page (Google account required) (opens in a new tab)
AI Doc Summarizer Doc Summary
AI Doc Summarizer Thinking Thinking

How to rename, tidy up, copy or remove the charts at the top of a module dashboard, change the field a chart shows, and save the change for everyone who uses that view.

Applies to: system administrators (admin role). Module: any module with a dashboard (the example uses Incidents).

Before You Start #

  • Chart changes are part of the module’s list view. They only reach other users once you save them to a view with Admin > Save…, so work on your company-specific view, not a -generic one. See Creating Your Own Custom Views.
  • If you only want to rearrange charts for yourself (tabs, grow, shrink, group), use Dashboard Layout Tools instead. Those changes don’t affect anyone else.

The Chart Options #

  1. Open the module, for example Incidents.
  2. Click the three dots (⋮) at the top right of the chart you want to change.

Administrators see three extra options above the layout tools:

  • Set up… (1): opens the chart’s settings.
  • Duplicate (2): adds a copy of the chart next to it.
  • Remove (3): takes the chart off the dashboard.
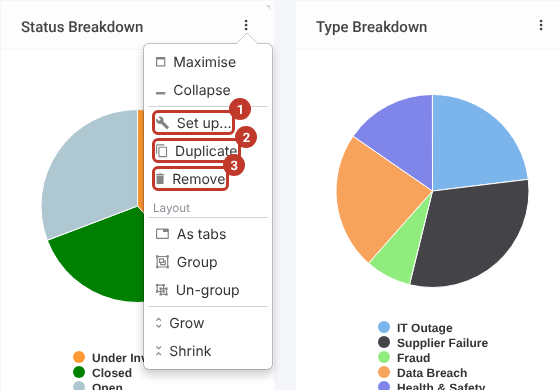
Chart three dots menu with Set up, Duplicate and Remove highlighted

Note: Users without admin rights only see Maximise and Collapse on this menu.

Changing a Chart’s Settings #

  1. Click Set up… on the chart’s menu. The chart editor opens.
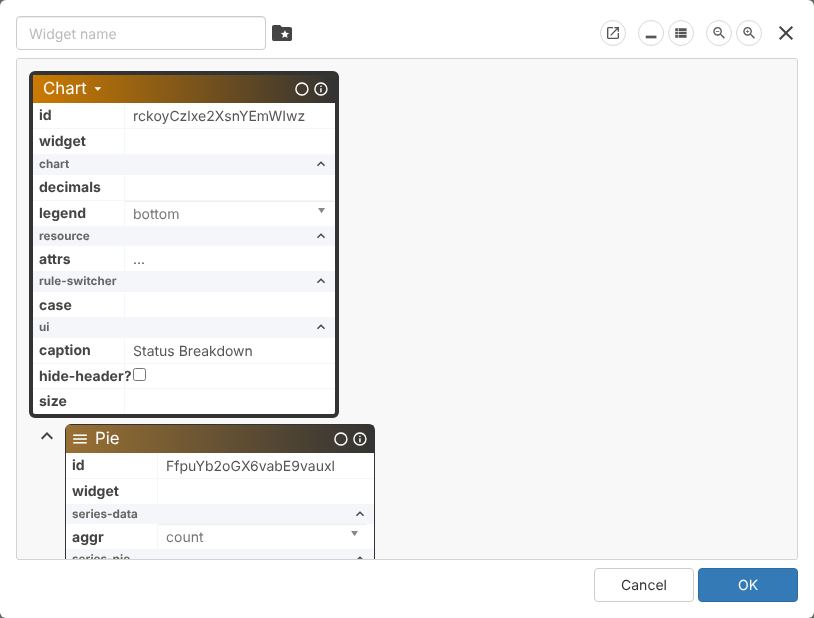
The chart editor showing the Chart and Pie settings boxes

The editor shows the chart as boxes of settings. The top box (Chart) holds the settings for the whole chart:

  • caption (1): the title shown at the top of the chart, for example change Status Breakdown to Incidents by Status.
  • hide-header? (2): tick to hide the title bar.
  • legend (3): where the key is shown: bottom, top, left, right or hidden.
  • decimals (4): how many decimal places to show for values.
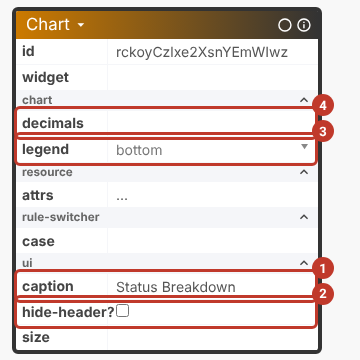
Chart settings with caption, hide-header, legend and decimals highlighted

Scroll down to the box for the chart type (here Pie). Its settings depend on the type. For a pie chart:

  • aggr (1): how records are counted. count (the number of records) is the usual setting; the other options (avg, sum, min, max and so on) are for charts built on a number field.
  • percentage? (2): tick to show each slice as a percentage instead of a count.
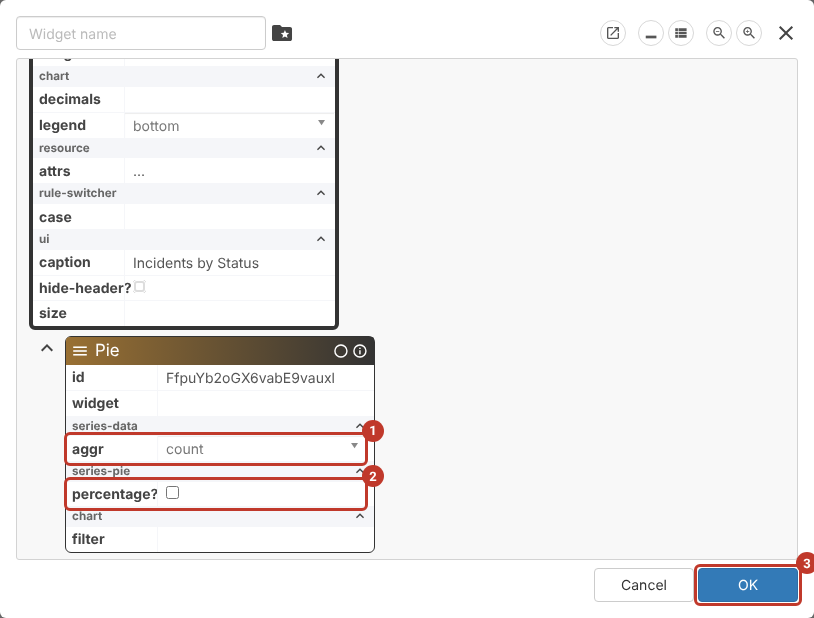
Pie settings with aggr and percentage highlighted, and the OK button

  1. Make your changes, then click OK (3). The dashboard updates straight away, but only on your screen until you save the view (see below).
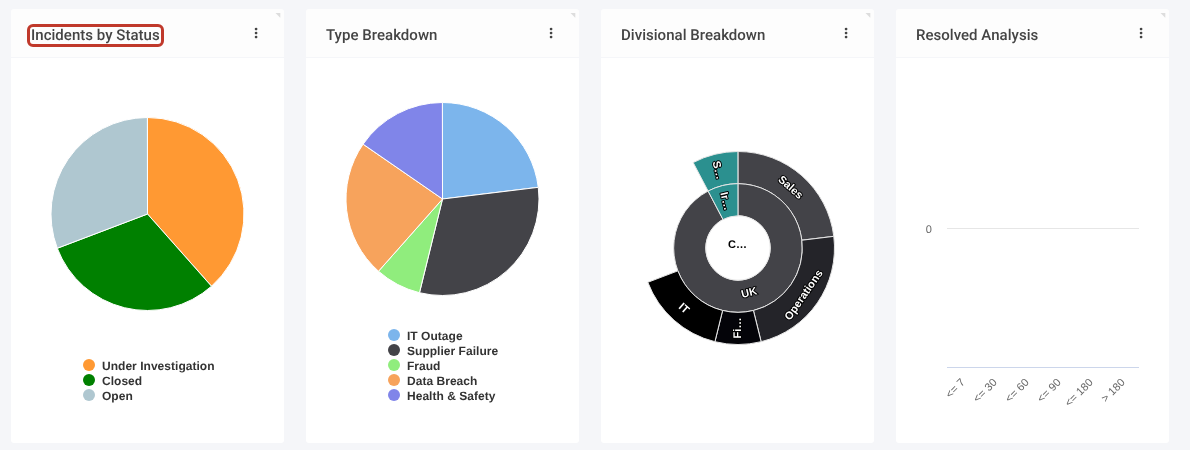
The dashboard with the first chart now titled Incidents by Status

Note: Other chart types have their own settings. For example, the Resolved Analysis bar chart has a Column box with band and period settings.

Copying or Removing a Chart #

  • Duplicate adds an identical copy next to the original (highlighted below). Use Set up… on the copy to give it its own caption and settings.
  • Remove takes the chart off the dashboard. Nothing is deleted from your records.
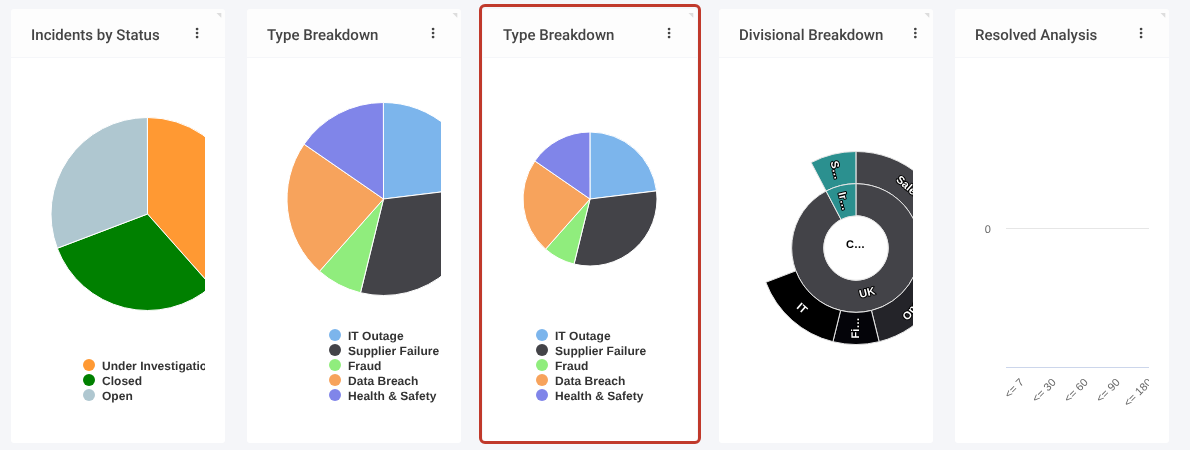
A second Type Breakdown chart added next to the original

Tip: Changed your mind? Leave the module and come back before saving: the dashboard goes back to the saved view.

Changing the Field a Chart Shows #

Charts break records down by one field, for example Status or Type. To change that field you need the field selector (shown as attr in the editor). It is switched off by default; ask Symbiant Support to turn it on for your administrator account.

A quick way to build a new chart is to duplicate an existing one of the same type and point the copy at a different field. In this example a copy of Status Breakdown becomes Impact Breakdown.

  1. Duplicate the chart (see above), then click Set up… on the copy and change its caption, for example to Impact Breakdown.
  2. Scroll down to the chart type’s box. With the field selector switched on it shows three extra settings: attr (1), the field the records are grouped by; colour (2), which colour each slice uses; and label (3), the text shown in the legend.
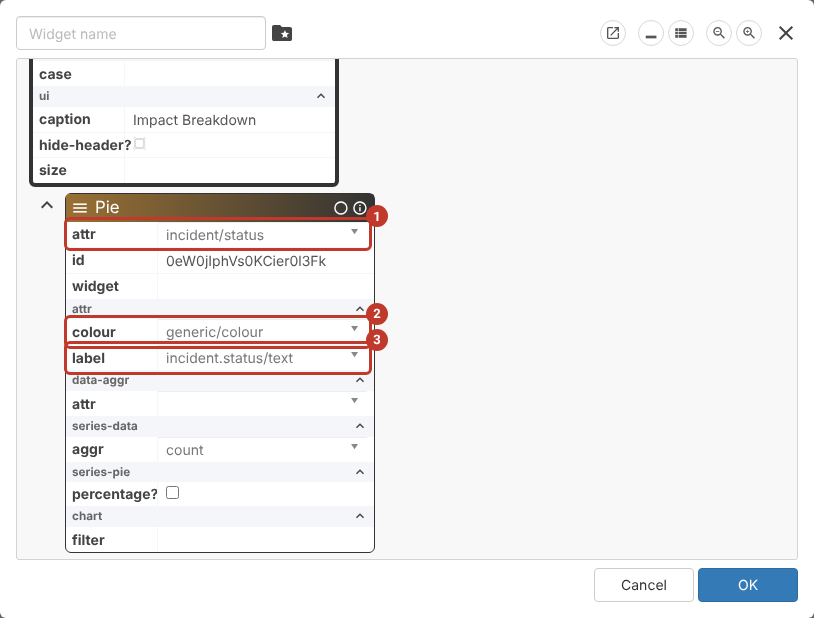
Pie settings showing attr, colour and label highlighted

  1. Click the attr box and pick the new field, for example incident/impact. Fields are listed by their system names; type part of the name in the search box to find one.
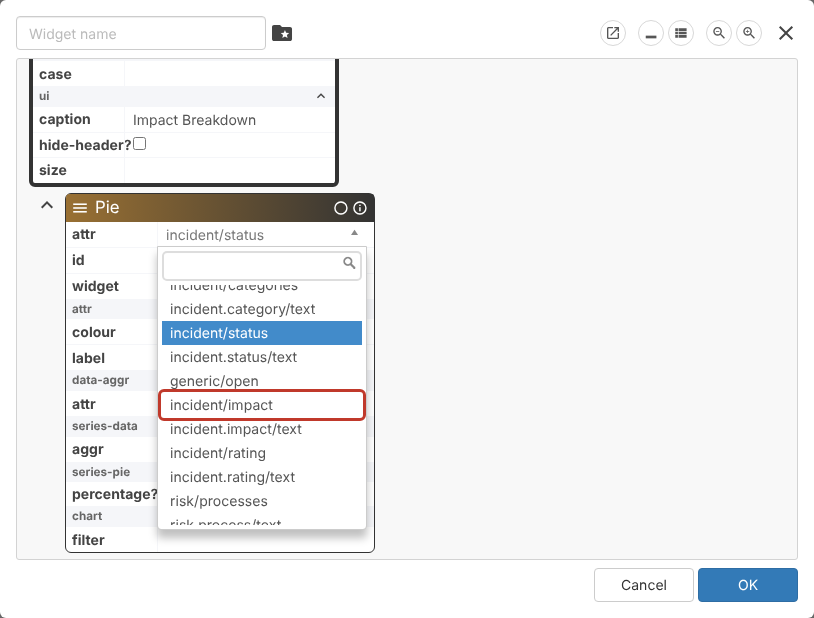
The attr list open with incident/impact highlighted

  1. Change label to the matching /text entry, for example incident.impact/text, so the legend shows the option names. Leave colour as generic/colour to use the colours set on the drop-down list.
  2. Check attr (1) and label (2), then click OK (3).
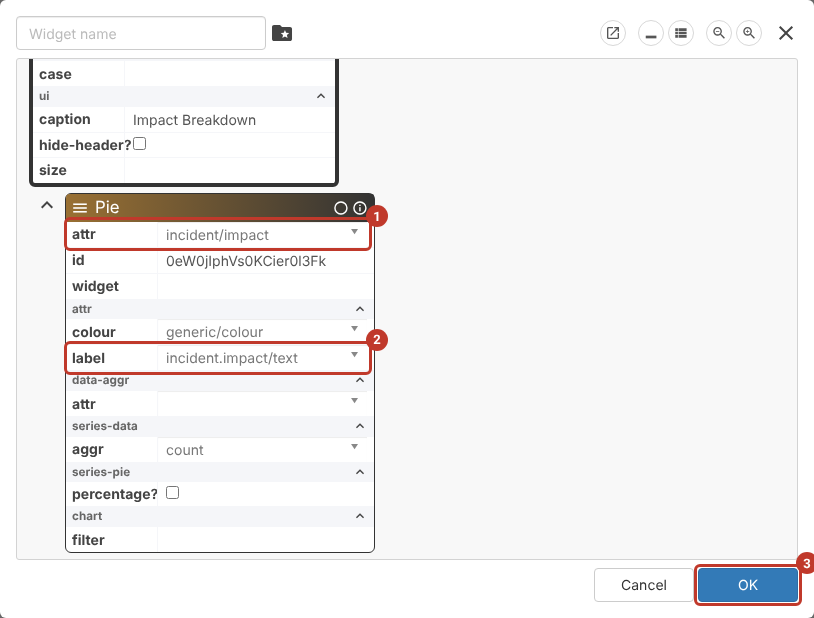
Pie settings with attr set to incident/impact, label set to incident.impact/text, and OK highlighted

The new chart appears straight away, using the field’s options and colours. Save the view as described below to keep it.
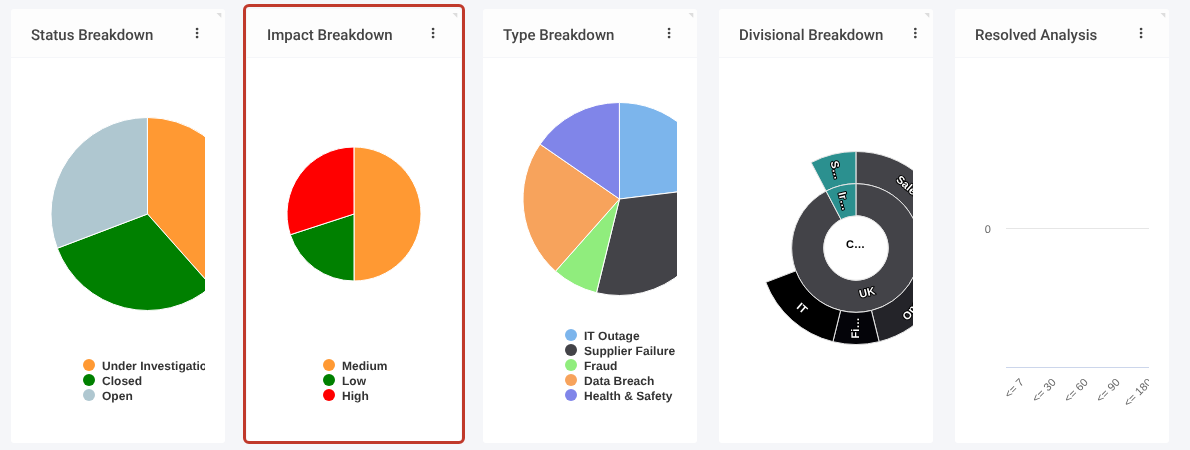
A new Impact Breakdown pie chart next to Status Breakdown

Note: Pie charts work best with drop-down fields that have a short list of options, such as Status, Type, Impact or Rating. For a drop-down field, attr is the field itself (for example incident/impact) and label is its text (for example incident.impact/text).

Saving the Change for Everyone #

  1. Click the three dots (⋮) at the top right of the screen, then Admin > Save….
  2. Pick your company-specific view to save over.
  3. Sign out and back in to see the saved change.

Critical: Don’t click the blue Save button at the top of the screen, and don’t save over a -generic view. See Loading/Saving a Particular User’s View.

Related Articles #

  • Loading/Saving a Particular User's View
  • Creating Your Own Custom Views
  • Dashboard Layout Tools
  • View Editor Tool Overview
  • Sharing Dashboard Layouts with Other Users
Did this help?

Share This Article :

  • Facebook
  • X
  • LinkedIn
Require Additional Information? Please Contact Support

How can we help?

Updated on 30 October 2026
Modifying a Currency Field to Set DefaultSharing Dashboard Layouts with Other Users
Table of Contents
  • Before You Start
  • The Chart Options
  • Changing a Chart's Settings
  • Copying or Removing a Chart
  • Changing the Field a Chart Shows
  • Saving the Change for Everyone
  • Related Articles
Symbiant System White Logo

20-22 Wenlock Road

London

N1 7GU

Linkedin
Telephone Numbers
  • UK - 0113 5263 755
  • Support - 0204 5514 735 option 2
  • USA - 347 991 7130
Information
  • Home
  • Knowledge Base
  • Symbiant Website
  • Submit A Ticket
  • Change Requests
  • Support Staff Login

Copyright © 2025 Symbiant All Rights Reserved - Risk, Audit and Compliance Management Software

We use cookies on our website to give you the most relevant experience by remembering your preferences and repeat visits. By clicking “Accept All”, you consent to the use of ALL the cookies. However, you may visit "Cookie Settings" to provide a controlled consent.
Cookie SettingsAccept All
Manage consent

Privacy Overview

This website uses cookies to improve your experience while you navigate through the website. Out of these, the cookies that are categorized as necessary are stored on your browser as they are essential for the working of basic functionalities of the website. We also use third-party cookies that help us analyze and understand how you use this website. These cookies will be stored in your browser only with your consent. You also have the option to opt-out of these cookies. But opting out of some of these cookies may affect your browsing experience.
Necessary
Always Enabled
Necessary cookies are absolutely essential for the website to function properly. These cookies ensure basic functionalities and security features of the website, anonymously.
CookieDurationDescription
cookielawinfo-checkbox-analytics11 monthsThis cookie is set by GDPR Cookie Consent plugin. The cookie is used to store the user consent for the cookies in the category "Analytics".
cookielawinfo-checkbox-functional11 monthsThe cookie is set by GDPR cookie consent to record the user consent for the cookies in the category "Functional".
cookielawinfo-checkbox-necessary11 monthsThis cookie is set by GDPR Cookie Consent plugin. The cookies is used to store the user consent for the cookies in the category "Necessary".
cookielawinfo-checkbox-others11 monthsThis cookie is set by GDPR Cookie Consent plugin. The cookie is used to store the user consent for the cookies in the category "Other.
cookielawinfo-checkbox-performance11 monthsThis cookie is set by GDPR Cookie Consent plugin. The cookie is used to store the user consent for the cookies in the category "Performance".
viewed_cookie_policy11 monthsThe cookie is set by the GDPR Cookie Consent plugin and is used to store whether or not user has consented to the use of cookies. It does not store any personal data.
Analytics
Analytical cookies are used to understand how visitors interact with the website. These cookies help provide information on metrics the number of visitors, bounce rate, traffic source, etc.
SAVE & ACCEPT
Loading...

Insert/edit link

Enter the destination URL

Or link to existing content

    No search term specified. Showing recent items. Search or use up and down arrow keys to select an item.