
 Doc Summary

How to see how your risk scores have moved: the standard score-history reports, running any report as at an earlier date, and viewing the risk dashboard as it was in the past.
Applies to: users with access to Register Risks reports; History mode on the dashboard needs a role that shows History on the options menu (usually admins). Module: Register Risks.
Choosing the Right Tool #
- Score-history reports: ready-made reports that compare scores over recent months. Best for a risk committee pack.
- Reports “As of” a date: run any report, such as the risk register, as it stood on a past date. Best for “what did the register look like at quarter end?”.
- History mode: view the whole Register Risks dashboard (heat maps, grid and records) as it was at a past date and time.
- Audit Trail: a list of every change to every field, with who made it and when. See Audit Trails.
Score-History Reports #
Go to Reports, choose Register Risks in the Module filter and generate any of these (see Generating a Risk Register Report):
- Risk Movement (Word): each risk whose residual score has changed, with its Previous Residual Score, Current Residual Score, Date Modified and owners.
- Risk Score History (Last 3 Months) (Excel): each risk’s inherent and residual impact, likelihood and score now, last month, two months ago and three months ago, with a dashboard sheet of charts.
- Inherent & Residual Risk History (6 Months) By Family (Excel): inherent and residual ratings for the last six months, grouped by risk family.
- Risk Score (Counts by Division and Category) Ageing (Word): counts of green, amber and red risks by division and by category, and how many months old each risk’s score is.
Note: These reports compare against earlier months, so they fill up over time. On a new site, or for risks added recently, the history columns stay empty until there is history to show.
Running a Report as at an Earlier Date #
- In Reports, find the report (for example Risk Register (Main)) and click Filter (1).

- Under Database (1), choose As of.
- Pick the date (2) with the calendar, for example the last day of the quarter.
- Click Close, then Generate (3).
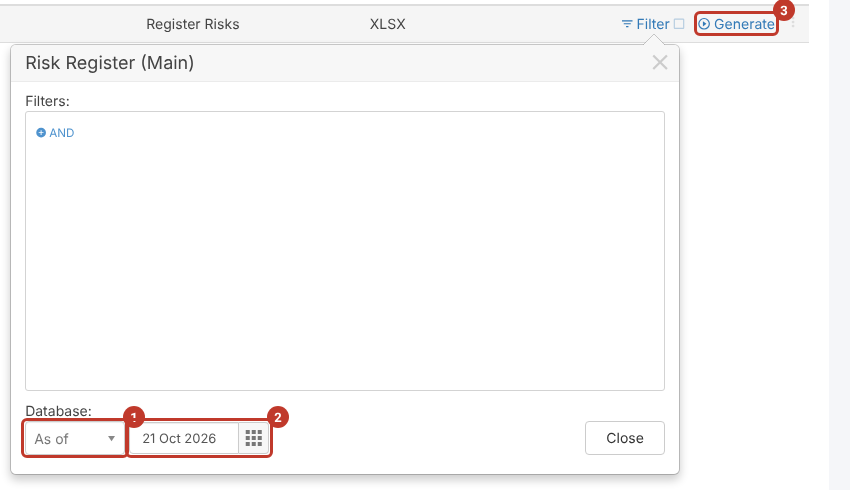
The report shows the risks, scores and other values as they were on that date. Generate the same report with Database set to Current to compare it with today.
Tip: Since works the same way and runs the report against the history of your data from the date you choose. Set Database back to Current when you’ve finished, or use the row menu’s Presets > Default. See Filtering on Reports.
Viewing the Dashboard as it Was #
- Open Register Risks, click the three dots (⋮) at the top right, then History (1).
- Choose a quick option (10 minutes ago or Yesterday) or Set time… (2).
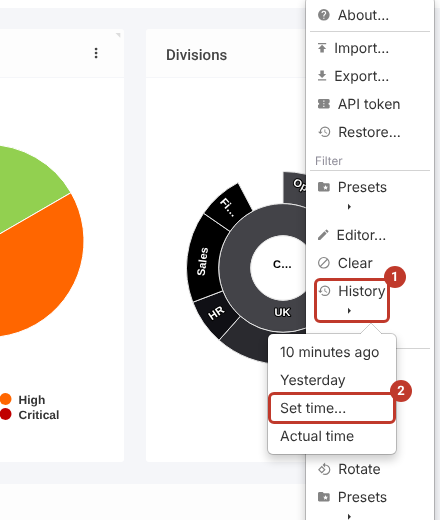
- For Set time…, pick the date (1) and time (2), then click Set (3).

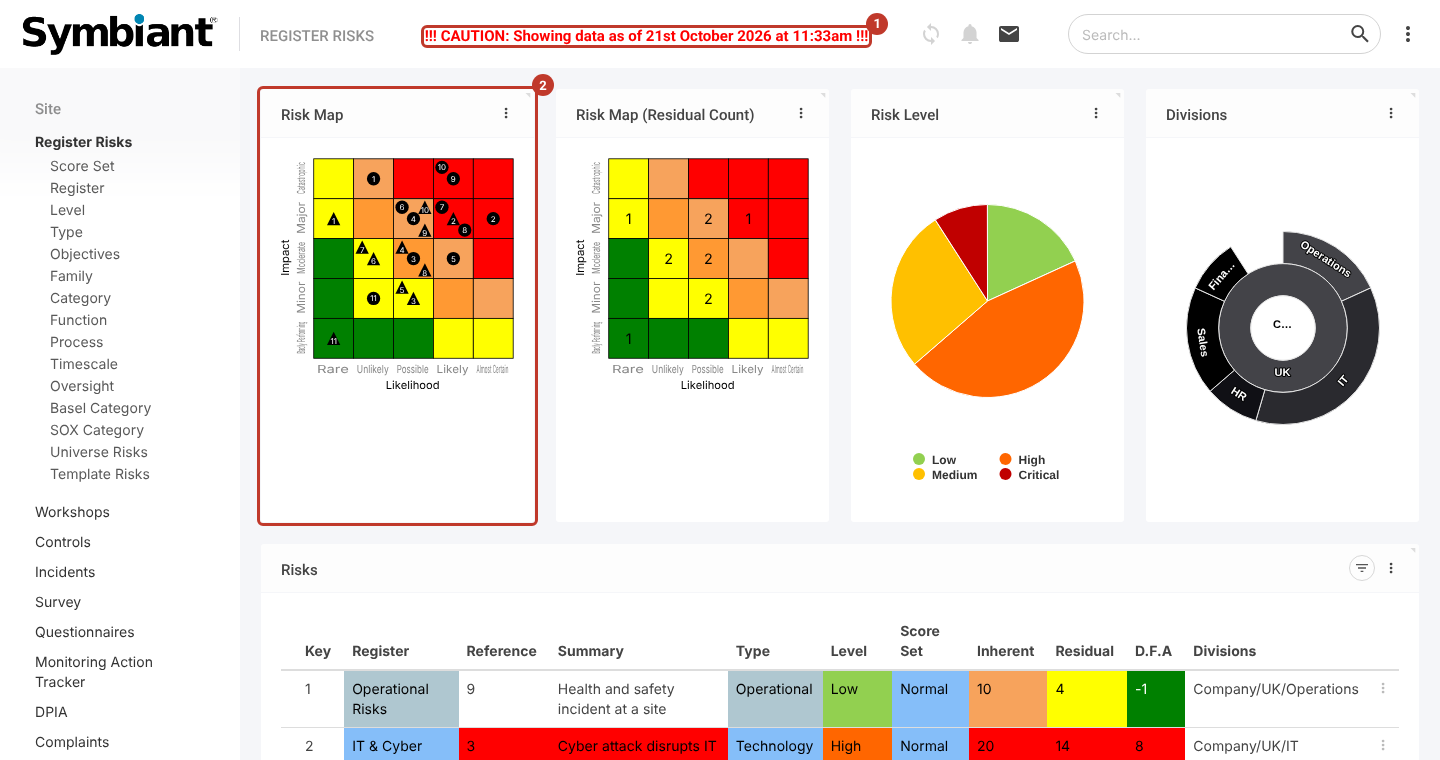
A red caution (1) at the top shows the date and time you are viewing. The heat maps (2), charts and grid show the risks and scores as they were then, so you can compare where risks sat on the map with today. Open a risk to see its Scores tab at that time.
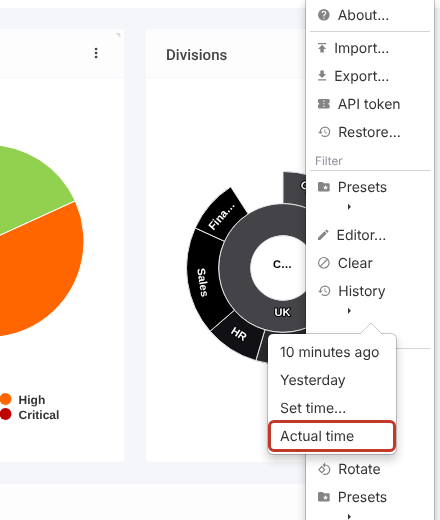
- To go back to live data, click ⋮ > History > Actual time.
Critical: While you are in History mode, don’t use History Save on a record unless you mean to restore that old version. It overwrites the current record. See Database History & Restoring Historical Records.